Exploration
The American chestnut is a large, deciduous tree of the beech family and is native to Eastern North America. It is one of four species of chestnut trees that exist in the world.
Prior to the 1900's, the American chestnut tree was integral to everyday life in the United States. Often referred to as "cradle to grave" trees, their rot-resistant hardwood was used to make everything from baby cradles to coffins. Wildlife thrived on the trees, which each year produced bumper crops of nuts.
The importation of the Japanese chestnut, in 1876, by a New York nurserymen unknowingly introduced a fungus, commonly known as chestnut blight, C. parasitica. Blight was first discovered on the American chestnut at the Bronx Zoological Park in 1904. Within 60 years, having no resistance to the blight, an estimated 40 billion American chestnuts were wiped out.
In an effort to establish blight-resistant strains of the American chestnut, breeding programs with the Chinese chestnut were developed in the early 1980's. The Chinese chestnut is not susceptible to the blight fungus.
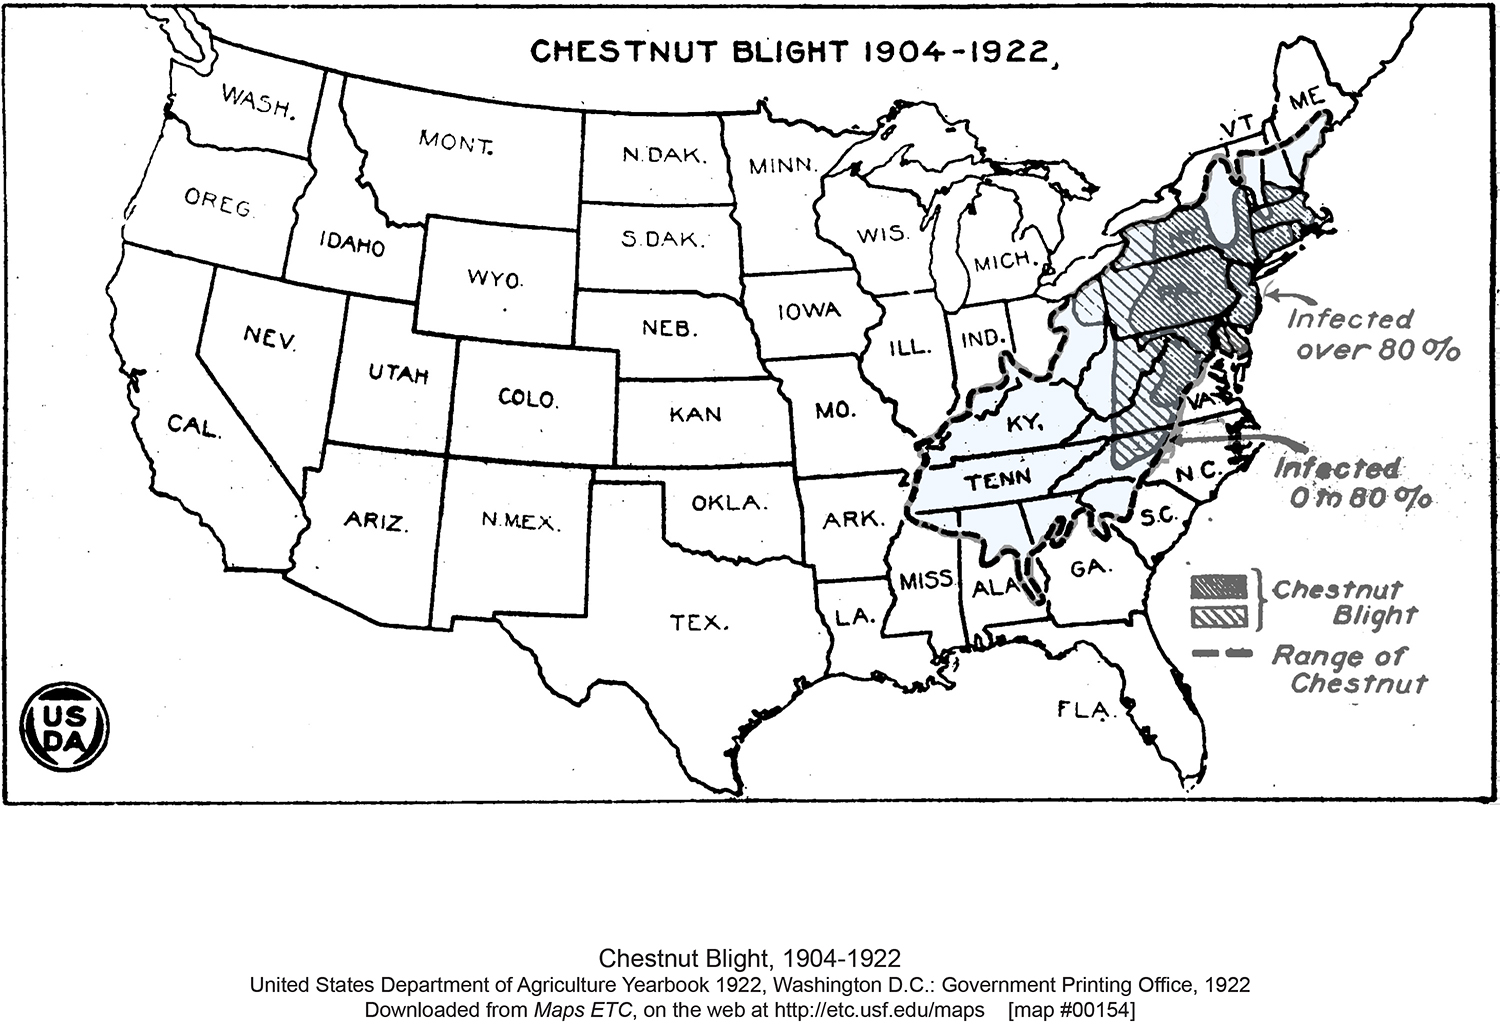
An interactive activity reinforces the value of the American chestnut and presents maps and photos that illustrate the effect of the blight on the American chestnut.

Objectives
Students will:
- Describe the impact of blight on the range of American chestnut population.
Lesson Materials
United States Department of Agriculture (USDA) Maps, American chestnut range and spread of the blight
ImageJ software program
Calculating the area of historic range
Procedures
Explore:
- Display or print the United States Department of Agriculture (USDA) maps of the American chestnut range and spread of the blight. Students or students groups will use the maps to:
a. Predict the spread of the blight by 1950 by drawing lines on the USDA spread of the blight map that indicate areas of spread by 1930, 1940 and 1950.
b. Calculate the area of the historic range of the American chestnut using the American chestnut range map and the ImageJ program. To calculate the area of the American chestnut historic range follow the instructions in the Calculating the area of historic range document.
IMPORTANT NOTE: The map scale is in km. Area calculated in ImageJ will be in km2. Conversion from km2 to Acres will provide you with an estimate of how close you have come to over 200 million acres once covered by American chestnuts. Good luck!
Explain:
What are some major impacts of the blight and it's destruction on the Eastern deciduous forest in the United States? Use categories like economic and ecological to help explain your answers.
Evaluate:
As a formative assessment have students or student groups present their predictions about the spread of the blight using the USDA maps, accuracy of their calculated range of American Chestnut, and the major impacts on the Eastern deciduous forest.
Standards
Examination of chestnut tree structures
References
ImageJ, http://imagej.nih.gov/ij/
USDA chestnut blight map, USDA yearbook, United States Department of Agriculture (Washington, D.C., Government Printing Office, 1923) http://etc.usf.edu/maps/pages/100/154/154.htm


