How To Calculate Biodiversity
Practice calculating biodiversity by following these steps.
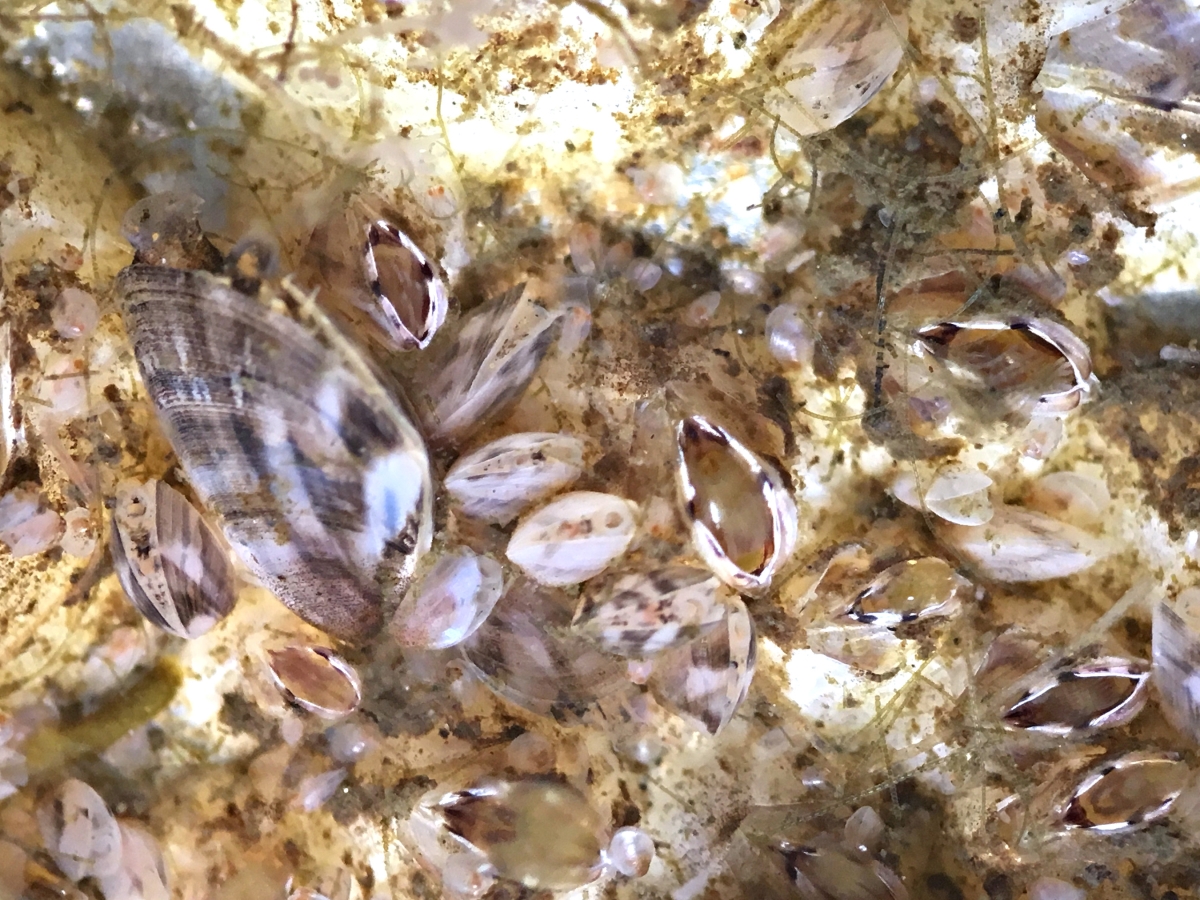
1. Identify the number of different organisms present.
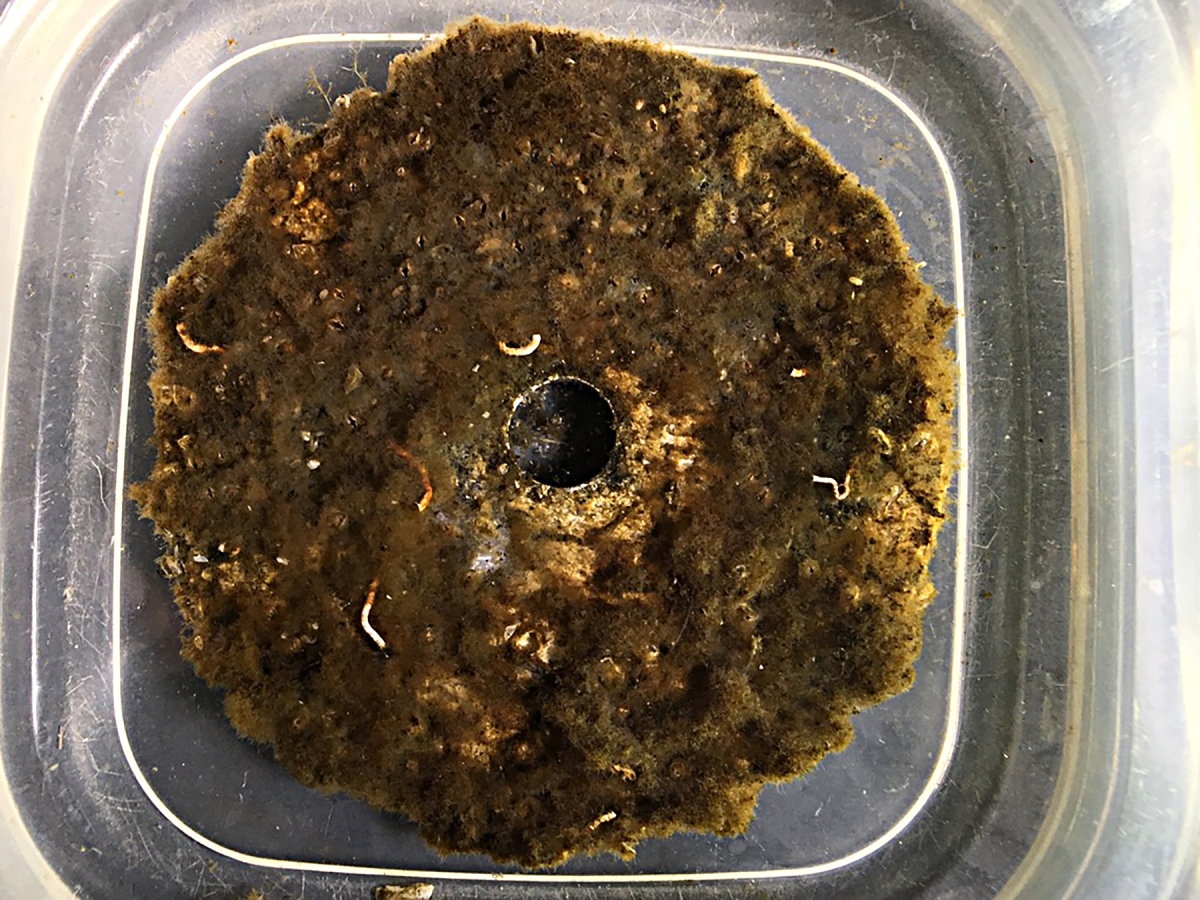
A stereomicroscope was used to identify the organisms found on the discs (visit the Featured Creatures page to learn about what these organisms are and why they are found on the discs). An area on the disc was selected at random for biodiversity analysis before it was viewed under the stereoscope (visit the Random Sampling page to learn how it is done).
Formula for Area
Area = π x r2
π = 3.1415
r = radius
The total area of the field of view analyzed was 1.5 cm2 at a magnification of 15 times. This technique was used for each sample to keep the data consistent.
2. Count the total number of each organism.
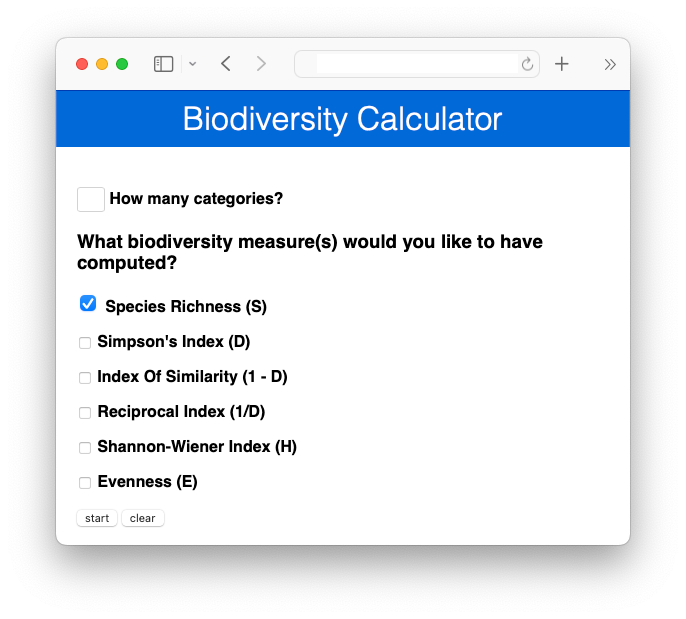
3. Use the numbers to estimate various measures of biodiversity.
- Species Richness (S): The total number of different organisms present. It does not take into account the proportion and distribution of each species within the local aquatic community.
- Simpson Index (D): A measurement that accounts for the richness and the percent of each species from a biodiversity sample within a local aquatic community. The index assumes that the proportion of individuals in an area indicate their importance to diversity.
- Shannon-Wiener index (H): Similar to the Simpson's index, this measurement takes into account species richness and proportion of each species within the local aquatic community. The index comes from information science. It has also been called the Shannon index and the Shannon-Weaver index in the ecological literature.
A comparison of one or all of these measures of biodiversity can illustrate changes in water quality conditions within a local community.
More About Measuring Biodiversity
When measuring biodiversity it is good to remember that what we are trying to describe is the relationship of individuals of varying categories within a community. These categories can be species, genera, families, or any other categories that you consider to be important. In our biofilm work, we use the number of individuals of each species observed (i.e., found on each disc).
There are some underlying assumptions that all measures of biodiversity have in common, which come from classic ecological research (like that found in Ecology by Eugene Odum):
The categories are well known.
In most cases, such as with our biofilm study, this assumption is not violated since the taxonomic classification of organisms that we use is accepted world-wide. However, this may be difficult if everyone does not use the same classification system (e.g., some people may put similar individuals into several categories while others use one category). This can happen when species are regrouped into new species, genera or families.
All categories are equally different.
Categories are equally different from each other category. This is not always true since two species from the same genera are treated the same as two species from different families.
Use a measure of species importance.
Usually, one uses the number of individuals, percent coverage, relative density or biomass. The choice usually depends on the ease of measurement. In our case, we use the number of individuals in each species observed.
The community under study is well defined.
The relative importance of an individual category will vary greatly depending on the definition of the extent and makeup of the community. The community in our biofilm studies is the local aquatic community near the pier.
Download the Biodiversity Calculator for use in the field without an internet connection.