Let's Calculate Biodiversity: Try These Data
In this activity, you will calculate measures of biodiversity, as discussed on the How To Calculate Biodiversity page. The data comes from one of the many datasets gathered during our study of biofilm formation in Baltimore's Inner Harbor.
Before you get started, here is a quick review of the biodiversity formulas:
- Species Richness (S): the number of different species found on the disc
- Pi: the number of a given species divided by the total number of organisms observed
When you compute the probability for each species, use decimal percent (e.g., 0.25; not 25% or 1/4) - Simpson's Index: D = sum(Pi2)
- Simpson's Index of Diversity: 1 - D
- Simpson's Reciprocal Index: 1/D
- Shannon-Weiner Index (H): H = -sum(Pilog[Pi])
While you may use any base, the natural log is commonly used - Evenness (E): E = H/log(S)
For more about each of these formulas, visit the How to Calculate Biodiversity page.
Assignment: Calculating Species Richness and Simpson's Index Using Three Species
Using the species counts, fill out the following tables to calculate the species richness and the three biodiversity indices develop by Simpson.
After you enter your answer(s) for each step, press the "Check Answer: button. You can use the "Clear Answer" button to clear the answer(s) for any part of this activity.
1. Calculate species richness (S)
Fill in the box with your answer and press the "check answer" button.
5. The final results look like this!
Click here to see the final results
| Species Name | # Found | Pi | Pi2 | Measure | Value | |
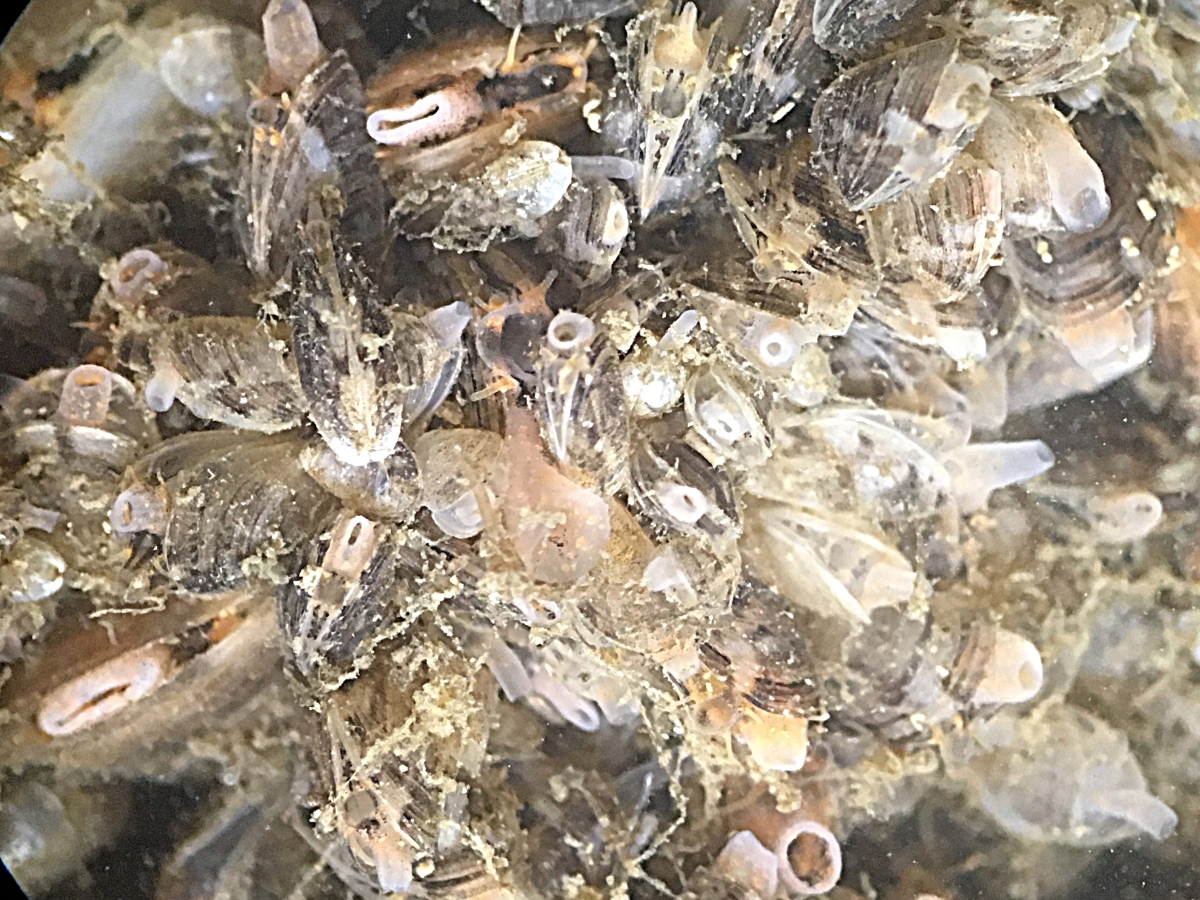
| Whip Mud Worm | 8 | 0.186 | 0.035 | S | 3 | |
| Mussels | 20 | 0.465 | 0.216 | D | 0.373 | |
| Barnacles | 15 | 0.349 | 0.122 | 1-D | 0.627 | |
| Totals | 43 | 1.000 | 0.373 | 1/D | 2.681 |
