Knauss legislative fellowships in Congress help build careers — and they're fun and educational. See our video and fact sheet for details.
R/E-25
Evaluating the Performance of Spatially Explicit Population Models to Estimate Abundance of Chesapeake Bay Fishes
Principal Investigator:
Michael WilbergStart/End Year:
2021 - 2024Institution:
Chesapeake Biological Laboratory, University of Maryland Center for Environmental ScienceCo-Principal Investigator:
Fellow: Samara NehemiahTopic(s):
- Fisheries
- Striped Bass
Strategic focus area:
Sustainable fisheries and aquacultureDescription:
Though fish populations typical experience spatially varying mortality, abundance, and fishing pressure, stock assessments commonly model a population that is assumed to be well-mixed. When assumptions about population mixing are not met, these models can result in biased estimates. Spatial population estimates are particularly beneficial to the Chesapeake Bay as this region faces unique challenges as a result of climate change, fishing pressure, and land use within the watershed. Though the Chesapeake Bay supports many important commercial and recreational fisheries, few assessments have estimated abundance of fish within the bay. However, use of spatial models for fisheries management relies on the ability of these models to reliably estimate biological parameters. This project will test the performance of spatially-explicit population estimates for the Chesapeake Bay. Objectives of this project are to 1) assess the performance spatially explicit stock assessment approaches for Striped Bass (Morone saxatilis) and determine how assessment model performance changes with data availability; and 2) determine how the performance of spatial stock assessments changes as a results of species range shifts due to climate change. Simulations will be built for estimating population abundance of Striped Bass with different temporal scales, movement rates, and patterns of fishing mortality. Based on model performance, I will identify data needs for reliable population estimates of fish species. Finally, I will explore how parameter estimates within the Chesapeake Bay may be affect by climate change induced range shifts. This project will serve as an evaluating of methods to assess population abundance for other ecologically valuable fish species in the bay and code will be made publicly available to assist in other stock assessments and studies.
Impact/Outcome:
The goals of this project were to 1) evaluate the performance of a spatially explicit stock assessment modeling approaches for striped bass (Morone saxatilis) and to understand how performance of spatially explicit models changes with data availability; and 2) determine how the performance of spatially explicit stock assessment models change as a result of changes in population dynamics (such as natural mortality) as a result of climate change and other processes.
Objective 1 - Evaluate the performance of spatially explicit models for striped bass
To evaluate the performance of spatially explicit models for striped bass, a simulation model was developed to better understand how spatial assumptions affect model output. Additionally, we considered how data inputs, such as assuming age data has ageing error, may affect estimates of abundance and fishing mortality rates from the model. Striped bass data primarily relies on age data that is informed by scale ages, rather than otoliths. However, scales can commonly overestimate younger striped bass and underestimate older striped bass compared to otolith which are less biased (Liao et al. 2013). For this simulation we developed an operating model (OM) to simulate a ‘true’ population and dynamics of striped bass. The OM developed was spatially explicit with two stocks (Chesapeake Bay and Atlantic coast), two areas (Chesapeake Bay and Ocean), and movement during two subannual 6-month time-steps. Additionally, the OM incorporated life history assumptions based on striped bass biology-based model outputs (e.g., recruitment estimates, movement rates, etc.) from a spatially explicit model developed in Nehemiah (2024).
Five stock assessment, or estimation models, with different spatial considerations and data inputs were developed to understand model performance. The first estimation model (FAA1) was a spatially implicit statistical catch-at-age model that does not explicitly consider spatial dynamics in population structure (e.g., recruitment, migration) but does assume that there are spatial differences in the fishery characteristics. This model does not address potential ageing biases in data sets. This model closely resembles the current assessment model used for management of striped bass. The second estimation model (FAA2) was a spatially implicit statistical catch-at-age model that addresses potential ageing biases using an aging error matrix. The third estimation model (SE1) was a spatially explicit, two-stock statistical catch-at-age model that does not address potential ageing biases in the data sets. The fourth estimation model (SE2) was a spatially explicit, two-stock statistical catch-at-age model that addresses ageing error in the data sets using an ageing error matrix. The fifth estimation model (SE3) was a spatially explicit, two-stock statistical catch-at-age model that included data sets with increased quality that includes stock composition for the fisheries independent and dependent datasets. The fifth model also accounts for ageing error in data sets using an aging error matrix.

Figure 1. Boxplots of the distribution of relative errors, which describe accuracy and bias, in the last year of the simulation. Relative error is provided for the total abundance over stocks and regions (N), annual fishing mortality at age-8 (F-8), and fishing mortality that achieves a 40% spawning potential ratio (F40) for the entire population. The dashed red line represents when relative error is equal to 0, representing when the estimates are unbiased. The lower and upper hinge of the box represents the 25th and 75th percentiles. The middle line represents the median. The whiskers extend to the minimum and maximum values of relative error.
The results suggest model estimates were approximately unbiased when they closely matched the assumptions of the data generating model (Figure 1). Spatially-explicit model estimates were approximately unbiased likely because they closely matched the assumptions of the data generating model. Spatially implicit models resulted in unbiased estimates of total abundance, but overestimate estimates of fishing mortality. Additionally, models that did not correct for ageing error in data sources using an ageing error matrix provided severely biased and inaccurate estimates of fishing mortality, compared to models that appropriately corrected for ageing bias.
https://github.com/snehemiah/SE-model-performance
Objective 2 – Evaluate the impact of population changes over time
A simulation study was conducted to understand how spatially explicit model performance changes when populations are undergoing changes to their dynamics (e.g., changes in movement over time). For this study, five OMs were developed to represent potential “true” population dynamics for striped bass over time based on observed changes in the population. Each operating model included similar age-specific processes as the OM used for Objective 1. All OMs assumed two stocks, two regions, and that biological processes occurred during six sub-annual, two-month time-steps (e.g., Jan.-Feb., Mar.-Apr., etc.). The first OM (OM-B) resembled the OM developed for objective 1. The second OM (OM-M) assumed that striped bass natural mortality varied for each region and increased over time in the Chesapeake Bay. The third OM (OM-P) assumed migration of striped bass changed over time to reflect less time spent in the Chesapeake Bay. The fourth OM (OM-R) assumed striped bass recruitment in the Chesapeake Bay declined over time, on average. The fifth OM (OM-MPR) combined the assumptions from OMs 2-4 to assume time-varying natural mortality, movement, and recruitment.
Three estimation models were developed to evaluate how incorrect assumptions on natural mortality, movement, and recruitment, resulting from potential climate change affects (e.g., temperature increases), affected bias and accuracy of various assessment models. Estimation models were similar to those tested for objective 1 but did not include ageing error. The first estimation model (FAA) was a spatially implicit statistical catch-at-age model. The second estimation model (SE) was a spatially explicit, two-stock statistical catch-at-age model. The third estimation model (SE-S) was a spatially explicit, two-stock statistical catch-at-age model that includes data sets with increased quality that includes stock composition for the fishery independent and dependent datasets.
Our results suggest that spatially explicit models were better able to account for changes in recruitment and movement over time with relatively unbiased estimates of abundance (N) and fishing mortality (F; Figure 2). However, when true natural mortality changed over time but were not accounted for in the estimation models, all models yielded substantially biased estimates of abundance, spawning stock biomass (SSB), and fishing mortality. Ignoring time-varying natural mortality and migration can lead to the overestimation of striped bass abundance, potentially providing incorrect management advice.
Code for the simulation for objective 2 can be found at: https://github.com/snehemiah/Simulation_SEmismatch
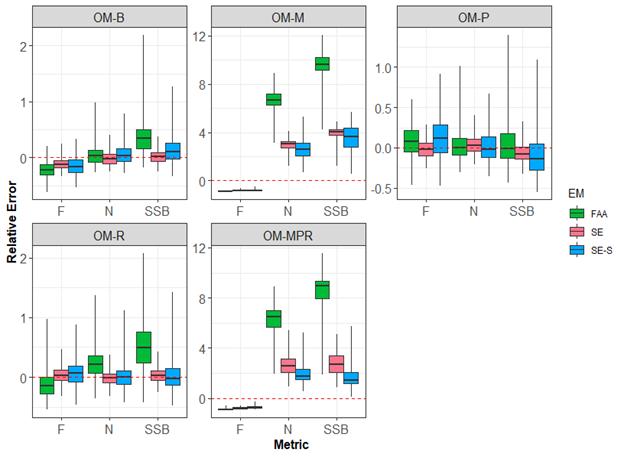
Figure 2. Boxplots of the distribution of relative errors of annual abundance over stocks and regions (N), spawning stock biomass on January 1 (SSB), and fishing mortality at age 8 in the last year of all operating model simulations for the three estimation models. The titles above each box indicate the operating models. The dashed red line represents when relative error is equal to 0, representing when the estimates are unbiased. Box and whisker definitions are in Figure 1.
Project Accomplishments
A Maryland Sea Grant fellow studied the accuracy of spatially explicit stock assessment models to estimate abundance and fishing mortality of striped bass in the Chesapeake Bay. The fellow found that these models—which consider how spatial dynamics like migration and fishing pressure vary across a population’s range—can provide more reliable estimates compared to traditional, nonspatial models. These findings could help improve management and support striped bass recovery in the Bay. The fellow went on to work as a fisheries stock assessment scientist with the Atlantic States Marine Fisheries Commission.
Read more
Relevance Striped bass (Morone saxatilis) are an ecologically and economically important fish in the Chesapeake Bay. Managers use stock assessment models to estimate fish abundance and inform management decisions, such as catch limits. Often, these models assume a fish population is well-mixed and uniform across its range. The striped bass population, for example, is traditionally assessed as one coast-wide stock from Maine to North Carolina. However, the spatial dynamics of a fish population—such as where and when they migrate and how much fishing pressure they face—can vary across their range. Models that take this spatial structure into account could provide more accurate estimates of fish abundance and mortality at a regional scale, such as in the Chesapeake Bay.
Response: A Maryland Sea Grant fellow led a study to test how spatially explicit stock assessment models—those that incorporate spatial information about a fish population—perform with varying amounts of data and spatial assumptions. The fellow ran five simulation models using generated “dummy” datasets with known abundance and fishing mortality rates. The fellow compared the accuracy of the spatially explicit models with traditional, nonspatial models. The fellow also looked at how inexact data or assumptions on factors including fish age and the number of fish that die each year can affect a model’s outputs. For example, a typical model assumes a constant rate of mortality each year, but striped bass natural mortality is expected to increase as waters warm. The fellow’s simulations found that failing to capture those changes leads to lower accuracy. In all cases, with sufficient data, the spatially explicit models outperformed the nonspatial models.
Results: The fellow’s dissertation research shows that spatially explicit models can potentially provide more reliable estimates of striped bass abundance and fishing mortality, and in turn, better information for regulators. The fellow has shared early results with scientists from state agencies, including the Maryland Department of Natural Resources, as well as recreational anglers with the Mid-Shore Fishing Club in Cambridge, Maryland. This work improves understanding of the population dynamics of striped bass in the Chesapeake Bay, supporting their recovery and securing their future as an important commercial and recreational fish. The fellow successfully defended their PhD on this work and will build upon it in a new position as a stock assessment scientist with the Atlantic States Marine Fisheries Commission.
Funding Start Year
2021
Funding End Year
2024
Program Announcements
News and Blogs


Featured Fellow
Nina Santos
Nina Santos is a Ph.D. student at the Chesapeake Biological Laboratory at the University of Maryland Center for Environmental Science. For her dissertation, she is focused on small shrimp-like crustaceans called mysids – an understudied yet important part of many estuarine and coastal food webs.
Featured Research Project
Developing a habitat model for mysids, an important link in Chesapeake Bay food webs
Mysids are important mesozooplankton prey for many species of fish in Chesapeake Bay and are an important link in transferring energy from lower to upper trophic levels. Mysids also serve as biological vectors for benthic-pelagic coupling due to their diel vertical migration and omnivorous prey-switching behavior, which makes mysids important regulators of food web architecture. Despite their central role in coastal food webs, surprisingly little is known about mysid ecology and dynamics in Chesapeake Bay.
