Knauss legislative fellowships in Congress help build careers — and they're fun and educational. See our video and fact sheet for details.
A New Look at Estimates for 20th Century Sea Level Rise
In the scientific world, numbers are like smart phones: by the time you get them out of the store, they're often out of date.
In a story last September I wrote that for much of the twentieth century, sea levels rose by "around 1.7 millimeters a year."
Except, that number may have been off, at least according to a recent report by scientists at Harvard and Rutgers University in New Jersey. In fact, the number I quoted may have been too high by about 30 percent.
The new findings raise an important question that often pops up around studies of sea level rise: why is it so hard to measure changes in the height of the world's oceans? Theoretically, it should be easy — just wade out into the surf and record how high the water gets. Is it to your ankles or your shins. But in reality, there are a lot of uncertainties about the estimates that scientists draw up for how fast the seas are rising.
In my reporting I talked to several scientists about why that is. They highlighted some of the big challenges associated with calculating the pace of rising seas, both close to and far from the Bay.
But first, here's a bit about that new study, which addressed the increase of water levels in the near past, as opposed to the increase we can expect to see in the future. For years, most studies that looked at the rates of sea level rise during the bulk of the 20th century — or from around 1901 to 1990 — tended to come up with similar numbers: during that era, the seas rose by about 1.6 to 1.9 millimeters per year on average.
In the new study, however, the Harvard and Rutgers scientists used a new type of statistical analysis to reexamine sea level records taken from around the globe. As a result they calculated that the actual rate of sea level rise between 1901 and 1990 might have been closer to 1.2 millimeters per year. I had overshot the mark.
This analysis, which was published in the scientific journal Nature in January 2015, doesn't disprove the fact that the seas are rising around the world and rising fast. Instead, it suggests that sea level rise is speeding up from what scientists call a lower "baseline." That means the rate of rise is accelerating faster than previously thought. Current rates of rise are now around 3 millimeters per year worldwide. And they're even higher on the Bay, hitting 4 millimeters per year or even more according to some estimates.
Still, how is it possible that two groups of scientists could study the same sets of sea level records and come away with different estimates for how fast the world's oceans were rising? According to the scientists I talked to, it comes down to two main problems.
The first is that sea level rise records are notoriously busy. Sea levels in a water body, such as the Atlantic Ocean or the Chesapeake Bay, can go up or down over long or short spans of time for many natural reasons. Larry Atkinson, an oceanographer at Old Dominion University in Virginia, told me that water levels along Norfolk are about 20 centimeters higher in the summer than they are in the winter. That's because when a body of water warms up, it expands in volume. The result is that sea levels rise and fall with the seasons. It's almost like the up and down motion of a person's chest as he or she breathes in and out.
With such big swings, it can be difficult for scientists to spot a difference in sea levels of just a few millimeters from one year to the next. It gets easier with time, however. Over decades, even small increases in sea levels — such as those associated with climate change — add up, says Robert Kopp, a paleoclimatologist at Rutgers who contributed to the Nature study.
"If you have a short record, it's going to be hard to pick out" the effect of climate change on the oceans, Kopp told me. "If you have a longer record, it's going to be pretty obvious that the sea level is going up."
That raises the second problem with measuring sea levels around the world: finding records of sea level rise that go back far enough.
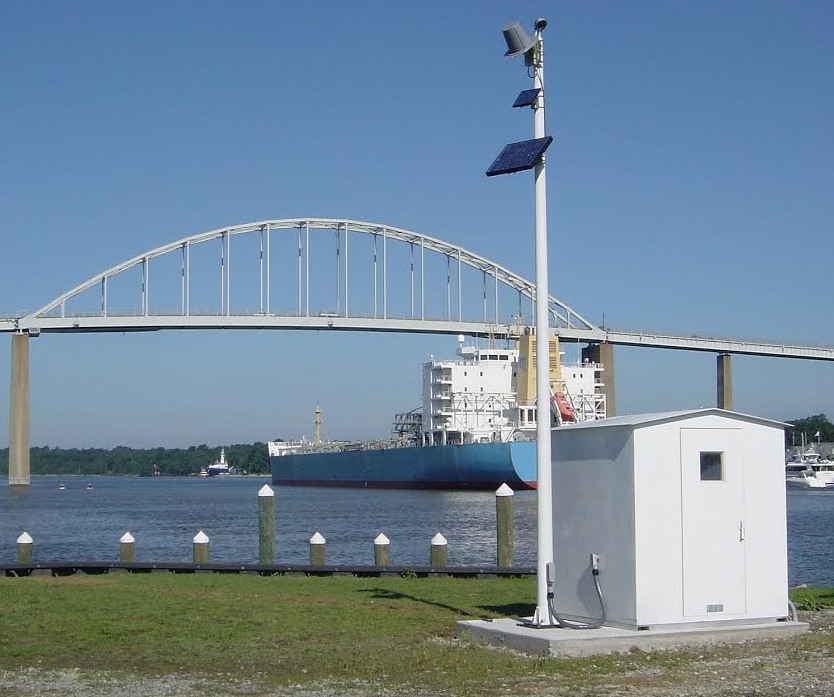 In this case, those records come from tide gauges, instruments that are installed off of docks and track the rise and fall of water levels nearby. Depending on where you are, tide gauge records can date back a long ways. The oldest such gauge in the Chesapeake Bay, for instance, was installed off of Baltimore in 1903. But that isn't the case everywhere. There are far fewer long-running tide gauge records in the southern hemisphere, for instance, than in the north. That means that scientists tend to have a more accurate picture of how the seas rose along locations like the Chesapeake Bay than they do around regions like southern Africa.
You can see the spotty coverage of global tide gauge records in this map from the U.S. National Oceanic and Atmospheric Administration. [http://tidesandcurrents.noaa.gov/sltrends/sltrends.html]
The end result is that scientists, like the Harvard and Rutgers group, turn to statistics to patch together incomplete records of sea level rise around the world. Think of it like a detective piecing together an incriminating letter from scraps pulled out of a fireplace.
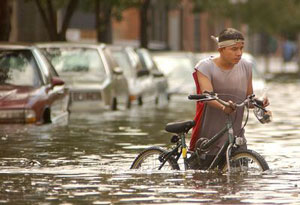
Despite these difficulties, efforts to calculate sea level rise trends in the past are worth it, said Carling Hay, a post-graduate researcher at Harvard and lead author of the recent Nature study. The more scientists know about how and why sea levels rose in the past, she said, the better they can understand how the oceans will behave in the years to come. That's important in regions like the Chesapeake Bay where even slight increases in water levels can mean the different between dry city streets and flooded ones.
Photos: (top) A Baltimore street during Hurricane Isabel, credit, Max Franz; (bottom) Tide gauge at Chesapeake City, credit, NOAA
See all posts from the On the Bay blog
Program Announcements
News and Blogs


ON THE BAY - BLOG ARCHIVE
ON THE BAY - BLOG TOPICS
Featured Fellow
Leone Yisrael is a cephalopod-loving scuba diver, cook, and loves to try new activities. She conducts genetic analysis and fieldwork at the Smithsonian Environmental Research Center through the Coastal Disease Ecology Lab.
Featured Research Project
Developing a habitat model for mysids, an important link in Chesapeake Bay food webs
Mysids are important mesozooplankton prey for many species of fish in Chesapeake Bay and are an important link in transferring energy from lower to upper trophic levels. Mysids also serve as biological vectors for benthic-pelagic coupling due to their diel vertical migration and omnivorous prey-switching behavior, which makes mysids important regulators of food web architecture. Despite their central role in coastal food webs, surprisingly little is known about mysid ecology and dynamics in Chesapeake Bay.

Chesapeake Quarterly Magazine
Restoration Takes Root: Living Shorelines for Changing Coasts