Knauss legislative fellowships in Congress help build careers — and they're fun and educational. See our video and fact sheet for details.
Learn to code and save time
From a young age, I’ve always gravitated toward science. With enthusiastic support from my dad, a hobbyist gardener, I remember growing tomato plants in different types of soil and observing their growth rate to test my hypothesis that tomatoes grown in an even balance of sand and clay would grow best. This project was my science fair entry in fourth grade. I didn’t win anything resume-worthy, but I had a great time talking to the judges about science, which was a win in my book.
Developing and testing hypotheses has become second nature as a graduate student, but now I’m dealing with different computer programs and software instead of tomato plants. One such software is called R, created by the R Project for Statistical Computing, was developed as an alternative to other statistical processing software such as Sigma Plot. R is unique among software options since it is an open-source program, where anyone and everyone can contribute to its development.
Many people not have even heard of R, but you’ve likely heard of Microsoft Excel, which used to be my go-to software for managing and visualizing my datasets. Many Excel users likely share the frustration I experienced with creating plots that are not only visually appealing, but accurately convey results. I have always struggled to make aesthetically pleasing figures in Excel, and often find that they do not save correctly, causing me to waste hours of my time painstakingly recreating a figure. Until I learned about R and starting using it, working with data was my least favorite part of science. I’m happy to say that it is now my favorite because of R.
In addition to making some truly incredible plots with your coding, other people can replicate your exact outcomes when you share your code. Plots in Excel lack this easy reproducibility. If you made a plot in Excel, there isn’t an easy way for someone else to look at your data and re-make the plot without spending a chunk of time on it. In R, as long as you have the correct version of the software and tools loaded, the other person can re-make a complicated plot in a fraction of the time—perhaps in mere seconds!
R may be most well-known for its infinite customization, but it also has fantastic data processing abilities. The software requires that you learn a computer language in order to code and successfully make full use of its capabilities. I’ve used R to help me manage large datasets, since my master’s research is producing a lot of data. Some of the analyses I conduct on those data are very time-consuming if done by hand, like calculating fetch.
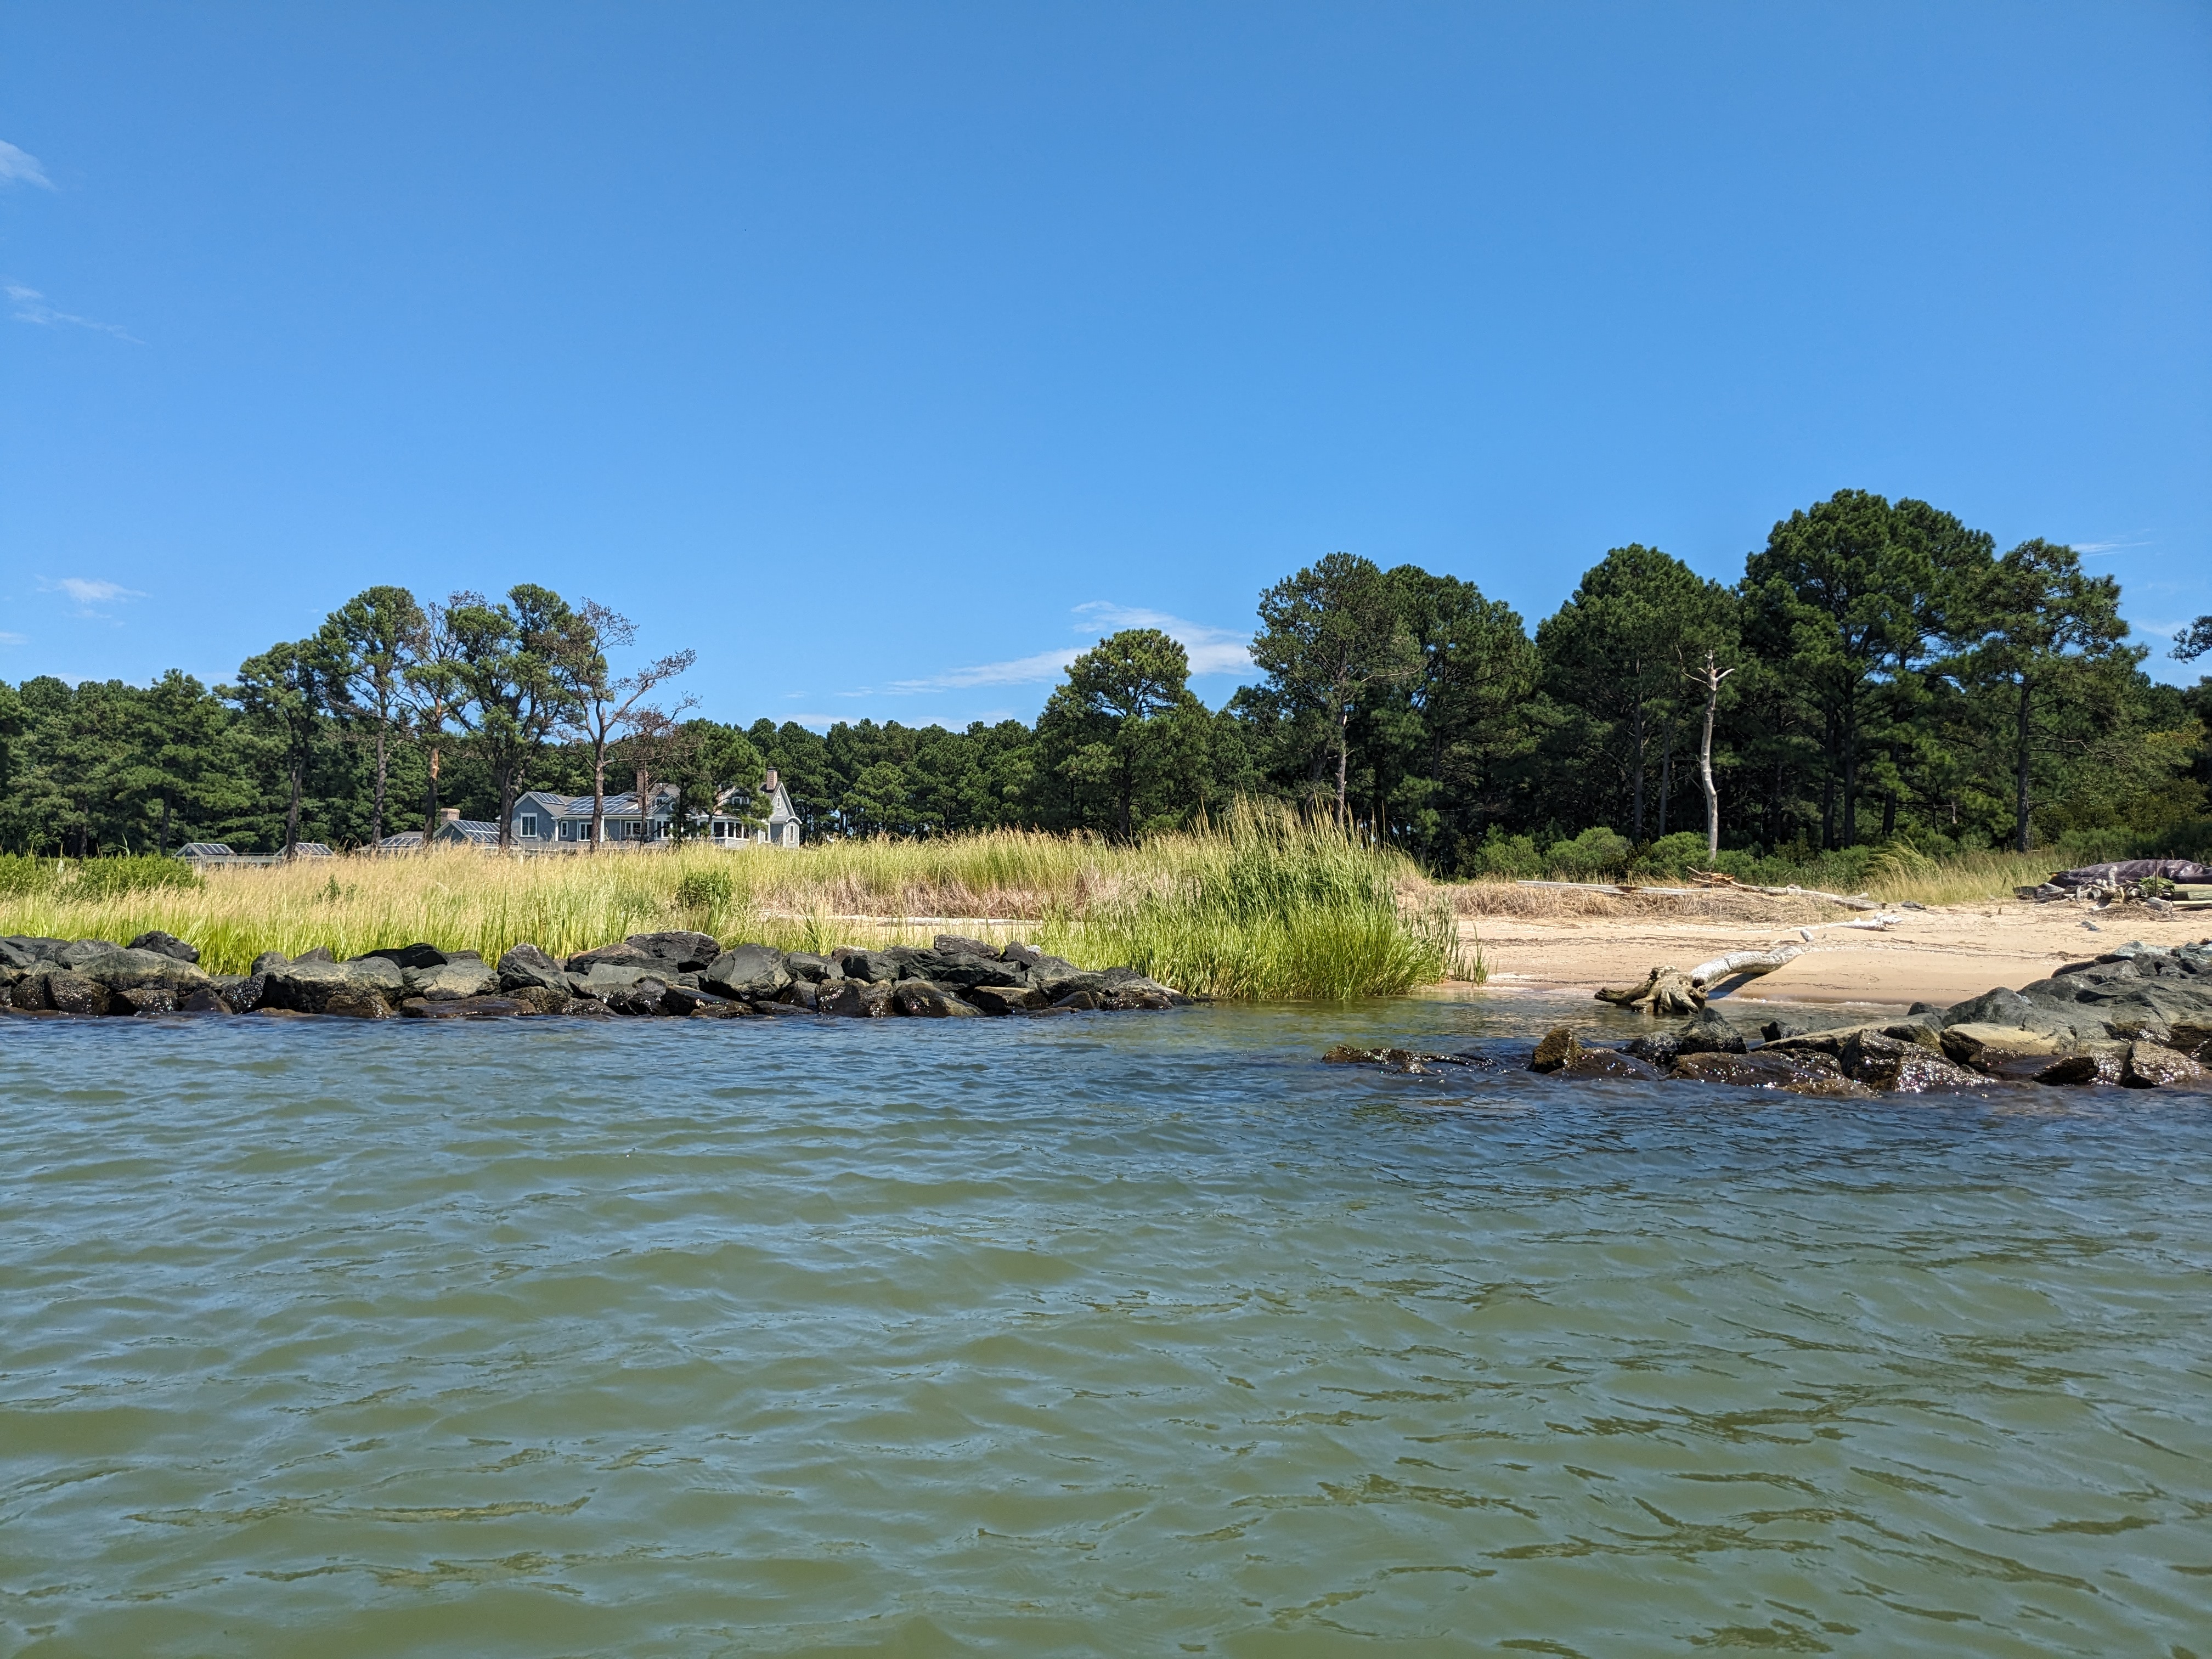
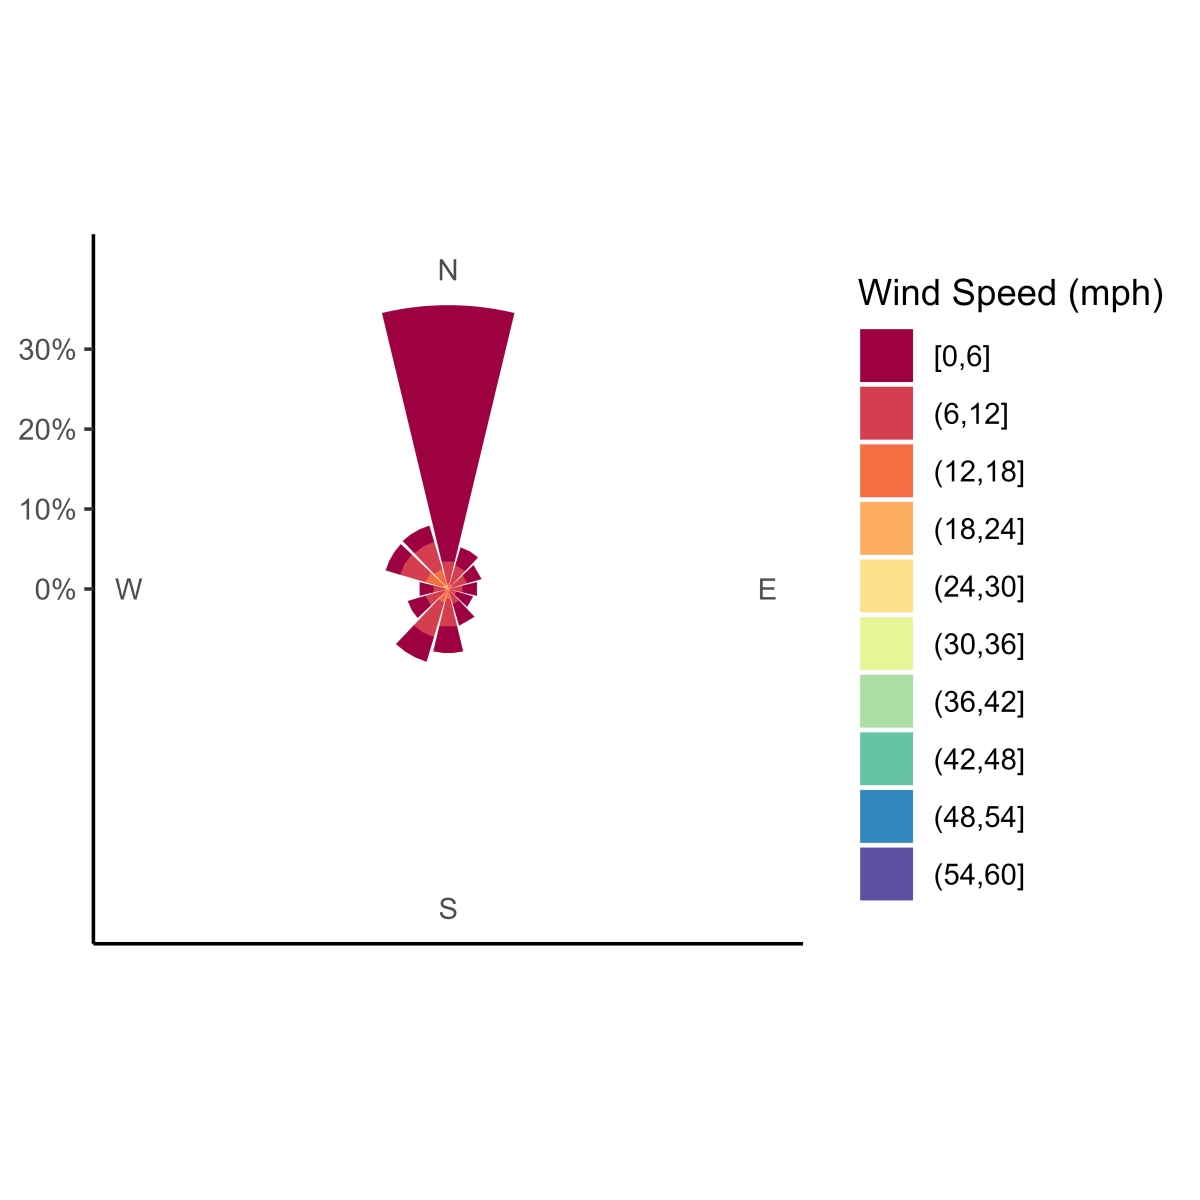
Fetch is a measurement of the distance where wind can travel unobstructed on open water. In my research on living shorelines, fetch is a critical metric that managers and planners use to determine if a living shoreline would be a good design for a section of shoreline. Too much fetch can create powerful wind-driven waves that erode the living shoreline, which is not the desired outcome. Calculating fetch involves making as many as 48 measurements around a single point on a shoreline to determine an average. If I am analyzing a handful of living shorelines, then automating that calculation is not necessary. I currently plan to analyze upwards of 100 living shorelines for fetch and could use a tool to make that process less time-consuming.
This is where R comes in. R did not have a tool that was included with the original software to calculate fetch by measuring those distances, but other R users have collaborated to develop a tool that does that. R has many features, but the most useful one is that the software was designed to be collaborative. Collaboration is an integral part of success in science. The saying goes: “If you want to go fast, go alone; if you want to go far, go together,” and this couldn’t be truer in the sciences. Success in science results from working together and using tools like R that work for you.
Top left image: A living shoreline on Tilghman Island, MD, that has a large fetch due to its proximity to the mainstem of the Chesapeake Bay. Photo: Erika Koontz
See all posts to the Fellowship Experiences blog
Program Announcements
Featured Fellow
Nina Santos
Nina Santos is a Ph.D. student at the Chesapeake Biological Laboratory at the University of Maryland Center for Environmental Science. For her dissertation, she is focused on small shrimp-like crustaceans called mysids – an understudied yet important part of many estuarine and coastal food webs.
FELLOWSHIP EXPERIENCES ARCHIVE
FELLOWSHIP EXPERIENCES TOPICS
Related Products

Chesapeake Environmentalism: Rethinking Culture to Strengthen Restoration and Resource Management
In the first issue of this monograph series, Chesapeake Perspectives, cultural anthropologist Dr. Michael Paolisso provides his perspectives on environmentalism and the Chesapeake. Building on his studies of diverse communities—from watermen to…
